grabowski
cf10f2e4c8
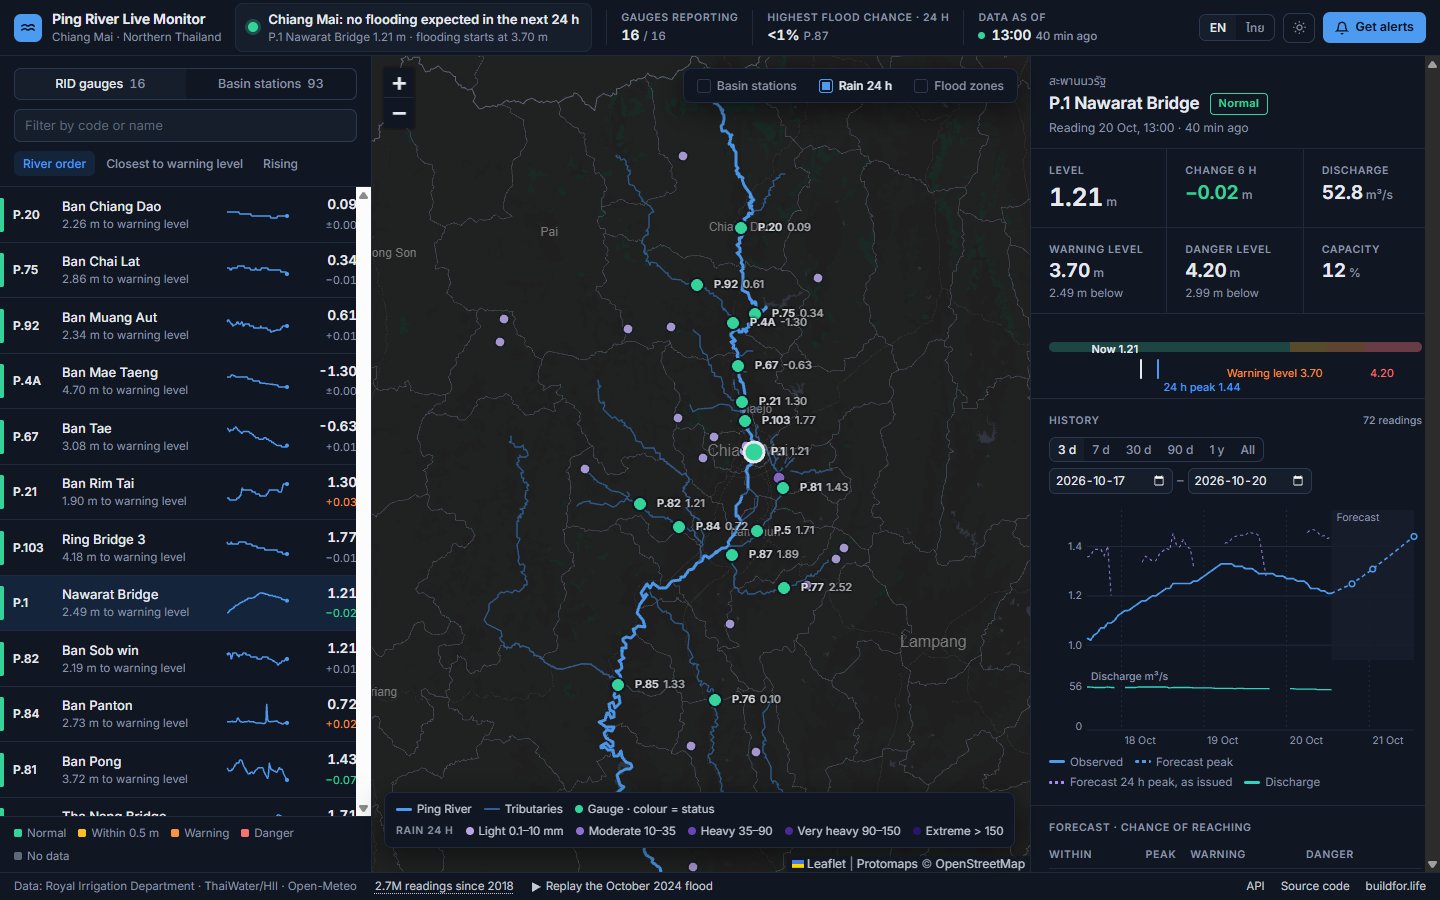
The console is now the dashboard at / (src/static/dashboard.html); the old
page and console.html are gone.

- Replay of the October 2024 flood (flood-2024-all.json): the page's clock,
  verdict, list, markers, flood zones and panel follow the replay; the panel
  charts the season on fixed axes with the 2024 model's 24 h peak. Hourly
  while the model alerts or P.1 is above 3.50 m, faster through quiet days;
  pause and drag. Rain, basin stations and the 5-minute refresh are off
  during the replay (today's data).
- ?demo_level= and ?demo_rise= simulate P.1. A violet REPLAY / amber
  SIMULATION bar, the top bar's KPI and the P.1 panel say so; the mode is
  drawn from state.mode alone, so a refresh or language switch cannot
  relabel either as live.
- History: rows without discharge_percent are ThaiWater's copy of the gauge
  (night hours RID publishes late), with a different rating (P.1: 26 against
  RID's 54 m3/s); their discharge is not drawn for gauges with RID discharge.
  The discharge strip has headroom so its label stays clear of the line.
- Swap: the old page's title, description, Open Graph and JSON-LD tags; no
  noindex; tests/test_dashboard.py = console tests + the old checks that
  still apply (one P.1 level, SEO files) + a replay/simulation labelling test.
- Docs: README screenshot (docs/img/dashboard.jpg, replacing two unused
  images), CLAUDE.md, CONTRIBUTING.md, FLOOD_FORECASTING.md (where the model
  shows), DASHBOARD_REDESIGN.md (phase 4 done, mode rules).

Deploy needs a restart: the server reads dashboard.html at start.
201 KiB
1440x900px
201 KiB
1440x900px